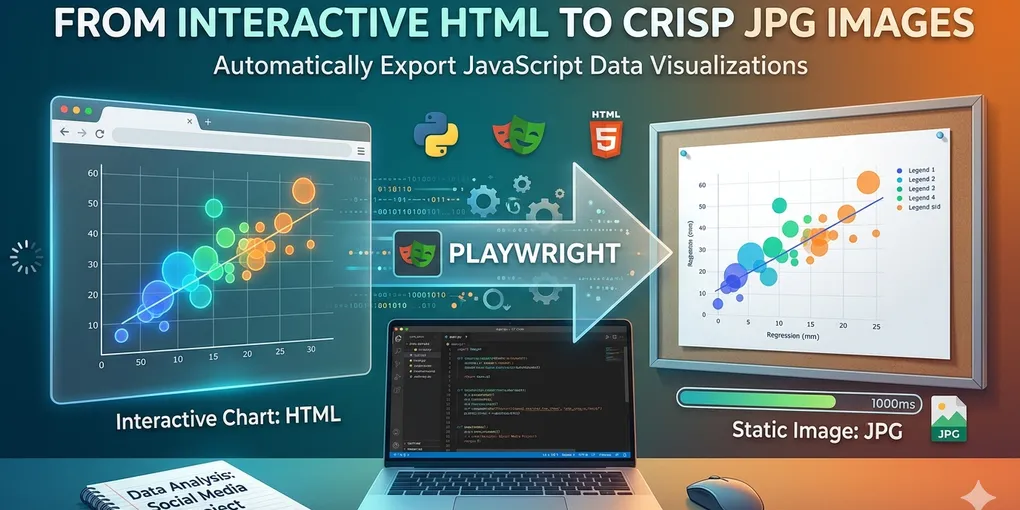
Automating Data Viz Exports with Python & Playwright. Convert Interactive HTML Charts to JPG
Introduction
Interactive charts are fantastic for exploration, but when it’s time to build a static report, slide deck, or PDF, things can get messy fast. Screenshots are clunky, browser print tools are unreliable, and many converters fail to capture charts that rely on JavaScript rendering.
That exact challenge came up in the project “Social Media Impact on Teen Mental Health.” Numerous interactive HTML charts were created to analyze trends, compare models, and visualize predictions. But static reports needed clean, high-quality chart images.
So, instead of taking endless manual screenshots, a custom Python automation tool was built using Playwright.
This solution waits for JavaScript charts to fully render before exporting them as 90% quality JPG files—making sure every legend, label, axis, and data point is captured perfectly.
Automating Data Viz Exports
Turn interactive HTML charts into report-ready images automatically — no more manual screenshots.
Quick Overview
In my project Social Media Impact on Teen Mental Health, I generated numerous interactive HTML charts. To include these in static reports, I built a Python tool that exports those charts into clean, high-quality JPG files.
Unlike standard converters, this solution uses Playwright to wait for JavaScript rendering to finish before taking the screenshot.
- ✅ Every data point captured
- ✅ Legends fully visible
- ✅ Axes rendered correctly
- ✅ Exported at 90% JPG quality
Why Standard Converters Fail
Many charting libraries rely on JavaScript to render visuals after the page loads.
That means traditional HTML-to-image tools often capture:
- ❌ Blank charts
- ❌ Missing legends
- ❌ Half-rendered graphs
- ❌ Broken labels
- ❌ Incomplete animations
Why Playwright Works Better
Playwright launches a real browser and waits until everything is fully loaded.
Key Benefits
- 🚀 Opens charts in Chromium
- ⏳ Waits for JavaScript execution
- 📸 Captures sharp screenshots
- 📦 Handles batch exports
- ⚡ Fast and reliable
Real Project Use Case
For Social Media Impact on Teen Mental Health, I created charts such as:
Model Comparison Charts
- XGBoost
- Random Forest
- Logistic Regression
- Decision Trees
Trend Visualizations
- Screen time vs anxiety
- Sleep disruption patterns
- Self-esteem metrics
- Platform usage trends
Example Python Script with Playwright
Here’s a simplified version of how it works:
from playwright.sync_api import sync_playwright
import os

input_folder = "charts_html"
output_folder = "exports"

os.makedirs(output_folder, exist_ok=True)

with sync_playwright() as p:
    browser = p.chromium.launch()
    page = browser.new_page(viewport={"width": 1400, "height": 900})

    for file in os.listdir(input_folder):
        if file.endswith(".html"):
            path = f"file://{os.path.abspath(os.path.join(input_folder, file))}"
            page.goto(path)

            # Wait for JS rendering
            page.wait_for_timeout(3000)

            output_name = file.replace(".html", ".jpg")

            page.screenshot(
                path=os.path.join(output_folder, output_name),
                type="jpeg",
                quality=90,
                full_page=True
            )

    browser.close()