Insights & Stories from the Field.
Reflections, technical deep-dives, and lessons learned at the intersection of data, engineering, and social good.
-
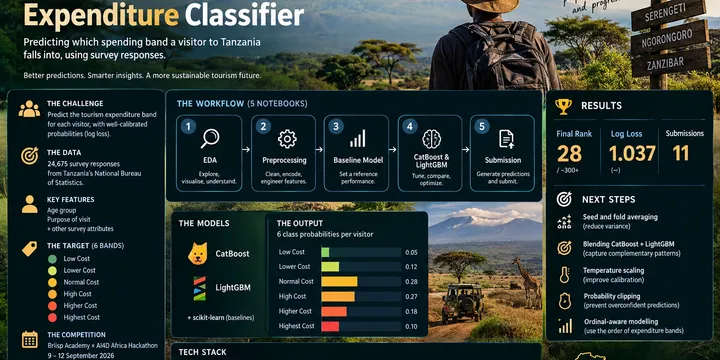
Machine Learning in Practice: My Journey Building the Tanzania Tourism Expenditure Classifier
From Survey Responses to Spending Bands. The Tanzania Tourism Expenditure Classifier is a hackathon project that predicts how much a visitor will spend in Tanzania. Using 24,675 national survey responses, CatBoost, LightGBM and a reproducible notebook pipeline, it turns raw data into calibrated probabilities across six expenditure bands, scored on log loss.
Read More → -

Automating Data Viz Exports with Python & Playwright. Convert Interactive HTML Charts to JPG
Learn how to automate data visualization exports using Python and Playwright. Convert interactive HTML charts into high-quality JPG images after JavaScript rendering finishes.
Read More → -

Data Engineering: The Invisible Backbone of Innovation
The Blueprint Behind the Intelligence. Behind every successful AI model and business dashboard is a robust infrastructure that most people never see. This post explores the world of Data Engineering—the essential discipline of designing and maintaining the pipelines that turn raw, messy data into high-quality fuel for innovation.
Read More → -

Data Engineering in Practice: My Journey Building the Superstore Analytics Ecosystem
From Raw Data to Regional Strategy. The Superstore Sales Project is an end-to-end data engineering and analytics ecosystem designed to uncover the "why" behind retail performance. Moving beyond basic spreadsheets, this project implements a professional ETL pipeline using Python, SQL, and PostgreSQL to transform messy historical data into a suite of interactive dashboards and predictive forecasts.
Read More → -

Bridging the Gap Between Raw Data and Strategy: Why I Built the KPI Generator
Stop staring at spreadsheets and start driving strategy. The KPI Generator is a Python-based automation tool that leverages Google Gemini AI to instantly transform raw CSV data into high-impact, actionable business metrics. By intelligently mapping data schemas to strategic goals, it eliminates "analysis paralysis" and provides a documented roadmap for data-driven decision-making in seconds.
Read More →