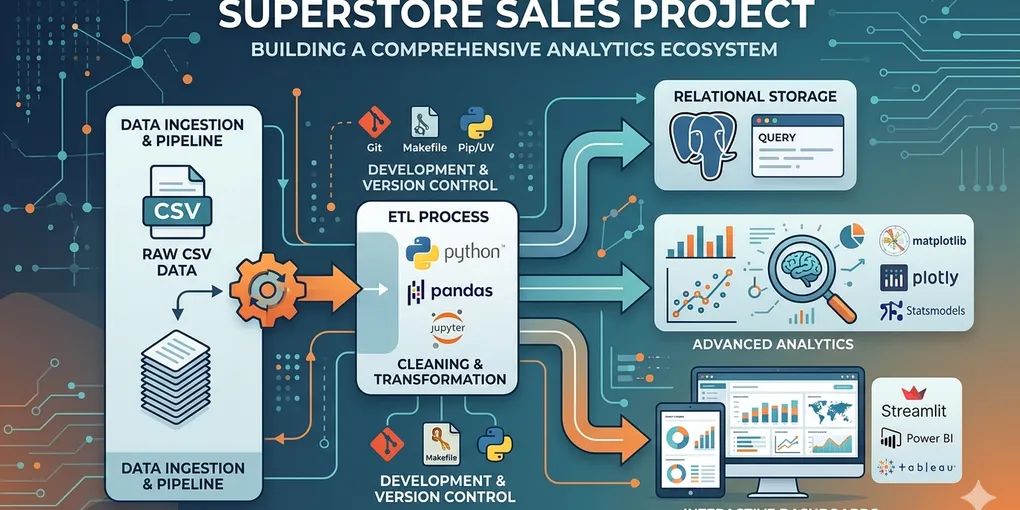
Data Engineering in Practice: My Journey Building the Superstore Analytics Ecosystem
Data Engineering in Practice: My Journey Building the Superstore Analytics Ecosystem
In the world of data, we often hear that “data is the new oil.” But oil is useless until it’s refined. Over the past few months, I’ve been refining a massive dataset of US retail sales into a high-performance analytics ecosystem.
This wasn’t just about making pretty charts; it was about building a professional-grade data pipeline that could survive real-world business requirements. Here is how I built the Superstore Sales Project and what I learned along the way.
The Vision: More Than Just a Spreadsheet
Most beginners open a CSV in Excel and stop there. My goal was to treat this like a real engineering product. I wanted a system that:
- Cleaned itself: Automated scripts to handle messy raw data.
- Stored itself: Integration with PostgreSQL for structured querying.
- Explained itself: Automated profiling and interactive dashboards.
The Architecture: How I Built It
1. The Modular File System
One of my biggest takeaways was the importance of Project Structure. I moved away from messy folders and implemented a professional directory:
/data/raw/– The “Source of Truth” (never modified)./data/processed/– Cleaned versions optimized for Power BI and Tableau./sql/– A dedicated library of queries for deep-dive investigation.
2. The Technical Stack
I chose a “Best of Breed” stack to handle different stages of the lifecycle:
- Python (Pandas & NumPy): My workhorse for data transformation.
- PostgreSQL: Used for relational data storage and complex joins.
- Streamlit & Plotly: To build a living, breathing dashboard that stakeholders can actually use.
- ydata-profiling: To generate massive HTML reports that catch data quality issues before they reach the dashboard.
Key Milestones & “Aha!” Moments
Automation via Makefile
I learned that manual work is the enemy of accuracy. I implemented a Makefile so that I could run the entire pipeline or launch the dashboard with simple commands like make run-main. This ensures that if the source data changes, the entire project updates in seconds.
Moving Beyond Simple Visuals
Through the Jupyter Notebooks phase, I didn’t just look at sales; I performed Predictive Modeling and Statistical Analysis. I learned how to forecast quantity and profit, moving the project from Descriptive (what happened?) to Predictive (what will happen?).
Lessons Learned (The Hard Way)
- Schema Design is Everything: Breaking the data into “Dimensions” (Customers, Geography, Products) made my SQL queries 10x faster and my Power BI models much easier to manage.
- Clean Data > Fancy Models: I spent a significant amount of time in
data_cleaning.ipynb. Handling null values and standardizing formats is where the real value is created. - Environment Management: Using virtual environments (
.venv) andrequirements.txtsaved me from countless “it works on my machine” headaches.
What’s Next?
This project served as the perfect precursor to my KPI Generator. While this project taught me how to build the pipes, my next step is to continue using AI to automate the insights that flow through them.
Explore the Project
Check out the full codebase, SQL scripts, and interactive notebooks on my GitHub: Superstore Sales Project Repository