Bridging the Gap Between Raw Data and Strategy: Why I Built the KPI Generator
Bridging the Gap Between Raw Data and Strategy: Why I Built the KPI Generator
In the world of data analytics, we often spend 80% of our time cleaning and prepping data, and only 20% actually thinking about what that data means for the business.
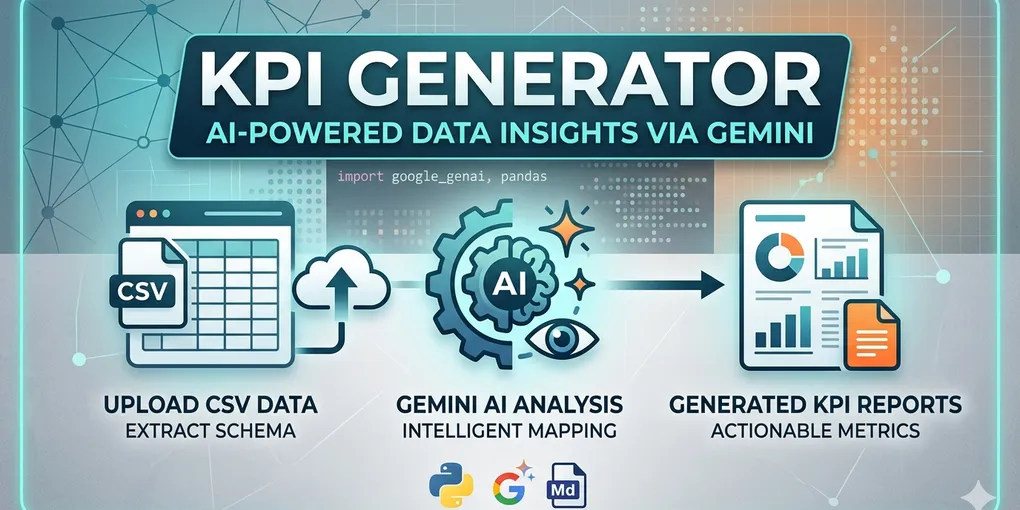
I’ve seen this bottleneck firsthand. Whether it’s analyzing retail sales for a superstore or managing logistics for a fleet, the jump from a CSV file to a strategic dashboard is often the hardest part. That’s why I built the KPI Generator—a tool that uses Google Gemini AI to automate the “thinking” phase of data analysis.
The Problem: Analysis Paralysis
When you open a new dataset, the questions are always the same:
- What are the most important columns here?
- Which metrics will actually drive growth?
- How do I explain these technical headers to a stakeholder?
Usually, this requires hours of manual exploration. I wanted a way to point a script at a folder of data and get a “strategic cheat sheet” instantly.
How It Works: The Tech Stack
The tool is built to be lightweight, secure, and fast.
1. Data Parsing with Pandas
I used Pandas to handle the heavy lifting of reading various CSV structures. Instead of sending the entire dataset (which would be slow and potentially a privacy risk), the script extracts the schema: the column names, data types, and sample distributions.
2. The AI Brain: Google Gemini
I integrated the google-genai SDK to process the data metadata. The core of the logic lives in a Prompt.txt file. This acts as the “Instruction Manual” for the AI, telling it to act as a Senior Data Strategist. It looks at the columns and identifies:
- Primary Metrics: Simple sums or counts.
- Derived KPIs: Complex ratios (e.g., “Customer Acquisition Cost” vs “Lifetime Value”).
3. The Automation Wrapper
To make it accessible for Windows environments, I created a .bat wrapper. This ensures the Python virtual environment is activated and the script runs with a single command—no need to remember complex CLI arguments every time.
Why AI? Why Now?
In 2026, AI is no longer just for generating text; it’s for augmenting logic.
By using an LLM like Gemini, the KPI Generator doesn’t just look for numbers; it understands intent. It knows that a column labeled ship_date and delivery_date can be used to calculate Logistics Lead Time, a crucial KPI for any supply chain business like Pangana Fleet.
Key Lessons Learned
- Context is King: The better the prompt, the better the metrics. Refining
Prompt.txtwas just as important as writing the Python code. - Privacy First: By sending schemas rather than row-level data, I ensured the tool remains useful for business environments where data security is non-negotiable.
- Portability Matters: Using a
.envfile for API keys and a clear requirements list makes it easy for other developers to clone the repo and start generating insights in minutes.
What’s Next?
I’m looking into expanding this to support multi-file relational mapping. Imagine the AI looking at a Customers CSV and an Orders CSV simultaneously to suggest deep-funnel retention metrics automatically.
Check it out on GitHub
If you want to automate your data strategy, you can find the full source code and documentation here: 👉 KPI Generator Repository