Superstore Sales Project


Sales Dashboard Report (2014–2017)
Methodology
-
Data Collection
Source data was obtained from Kaggle, providing the foundational sales dataset covering orders, customers, and regional performance across 2014–2017.
-
Data Cleaning & Transformation
The raw data was processed using Python, which handled cleaning, transformation, and preliminary statistical analysis — including handling missing values, standardizing formats, and deriving calculated fields.
-
Data Storage
The cleaned dataset was loaded into a PostgreSQL database, enabling structured querying and further statistical analysis at the database level.
-
Visualization
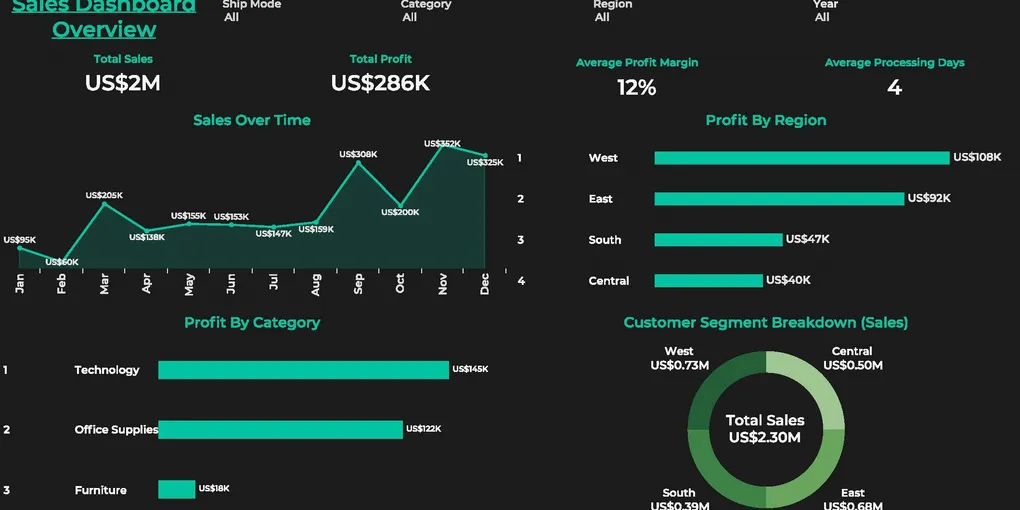
Dashboards and visual reports were built using both Power BI and Tableau, producing the regional sales, profitability, orders, and customer maps presented in the report.
Key Insights
Overall Performance
The business generated solid multi-year sales across all four US regions (Central, East, South, West), with California (2,001 orders, 577 customers) and Texas (985 orders, 370 customers) dominating order volume.
Profitability Red Flags
The profitability analysis reveals a critical issue: Texas is deeply unprofitable at -$25,729 , the worst in the entire country, despite being the #2 state by order volume. Other loss-making states include:
| State | Profit |
|---|---|
| Ohio | -$16,971 |
| Pennsylvania | -$15,560 |
| Illinois | -$12,608 |
| North Carolina | -$7,491 |
| Texas | -$25,729 |
High sales volume is clearly not translating to profit in these markets.
Star Performers
California leads profitability at $76,381, followed by Washington at $33,403 and Michigan at $24,463. These states deliver both high volume and strong margins.
Regional Imbalance
The West region (led by California and Washington) is carrying disproportionate profit weight relative to the Central and South regions, where losses are concentrated.
Recommendations
-
Investigate Texas immediately.
Nearly 1,000 orders with a -$25,729 profit is unsustainable. Likely causes include deep discounting, high shipping costs, or an unprofitable product mix. A category and customer segment audit is strongly advised. -
Review pricing and discounting in Ohio & Pennsylvania.
Both are high-order states running losses. These are large, recoverable markets worth fixing rather than abandoning. -
Double down on California & Washington.
These are the most profitable states with large customer bases. Prioritize retention, upselling, and expanded sales capacity in these markets. -
Assess structural margin issues in the Central region.
Colorado (-$6,528) and Arizona (-$3,428) suggest broader pricing or cost problems beyond isolated states. -
Align sales strategy to segment profitability.
Breaking down losses in Texas and Ohio by Consumer, Corporate, and Home Office segments would pinpoint whether the root cause lies in pricing, product mix, or customer acquisition costs.